Buenas tardes,
En esta oportunidad les quiero compartir un pequeño análisis sobre estadísticas de penetración de IPv6 en el mundo de contenido. En otras oportunidades (*1) hemos conversado
sobre estadísticas de penetración de IPv6 desde la perspectiva del usuario final. En lo personal me alegra mucho contar con este tipo de mediciones porque es algo que nos faltaba.
¿Qué quiere decir estadísticas de penetración de IPv6 en el mundo de contenido?Básicamente es saber cuánto contenido/servidores existe sobre IPv6, NO cuántos usuarios NI cuánto tráfico sobre IPv6 está siendo cursado.
ProblemasEl mayor problema que se encuentra es determinar con certeza cuál contenido se encuentra en un país. Recordemos que Internet es una red globalizada, saber que donde se encuentra el "host" de un dominio es algo muy complejo. Ciertamente existen muchas técnicas pero de igual manera no son 100% confiables. Ejemplo: indicar que el dominio www.example.com.ve está en Venezuela puede ser totalmente cierto, parcialmente cierto o totalmente negativo. Para poder llevar a cabo este estudio decidimos tomar únicamente dominios con ccTLD de nuestra región.
¿Cómo se realizó este estudio?Vamos a indicarlos por pasos para visualizarlo mejor:
1) Se toma un archivo con los TOP 1 millón de dominios del mundo (*2)
2) Se toma el ccTLD de los mismos (.ar, .uy, .br, .ve, etc)
3) Del punto 2 se averigua si tienen registros AAAA en su www
4) Del punto 2 se hace un estudio para averiguar si existen "embriones
IPv6", es decir, dominios que no tienen IPv6 en su www pero si tienen host con los nombres w6, www6, ipv6, v6 + dominio
Procesamiento:
- Del archivo Majestic Million con un millón de dominios, aproximadamente 8000 tienen ccTLD de la región de Latinoamérica y Caribe.
- Posteriormente se utiliza el dominio y se buscan registros AAAA para:
www + dominio
ipv6|v6|www.ipv6|www6|ip6|w6 + dominio
Resultados:De puede apreciar lo siguiente:
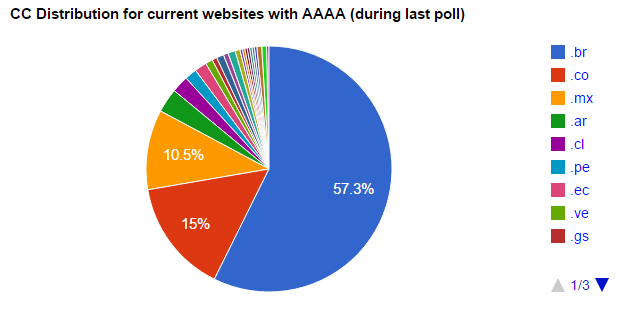
1.- Para Websites con IPv6 actuales:El top 5 de los países con Websites con AAAA tenemos:
Gráfico #1. Resumen países con sitios con registros AAAA
1.- Brasil cuenta con 180 sitios que representa el 57.3% del total
2.- Colombia con 47 sitios que representa el 15% del total
3.- México con 33 sitios que representa el 10.5% del total
4.- Argentina con 10 sitios que representa el 3.2% del total
5.- Chile con 7 sitios que representa el 2.2 del total
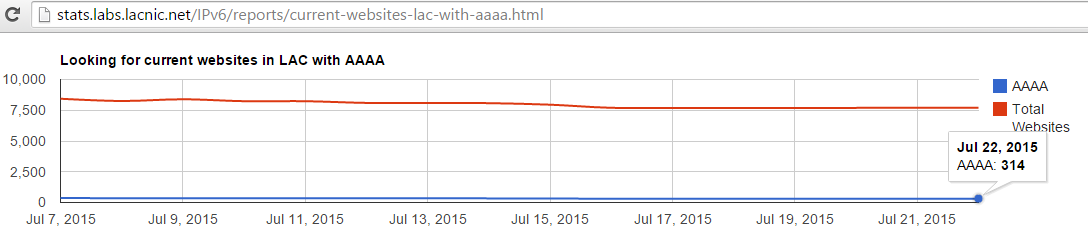
(estadísticas para el 22 de Julio, 7709 dominios estudiados y 314 Websites con AAAA)
Gráfico #2. Resumen sitios actuales con AAAA
2.- Para Websites embriones:El top 5 de los países con Websites embriones tenemos:
Gráfico #3. Resumen países con embriones IPv6
1.- Brasil 25 (con 45.5 %)
2.- Colombia 18 (32.7%)
3.- Mexico (9.1%)
4.- Perú 2 (3.6 %)
5.- Chile 2 (3.6 %)
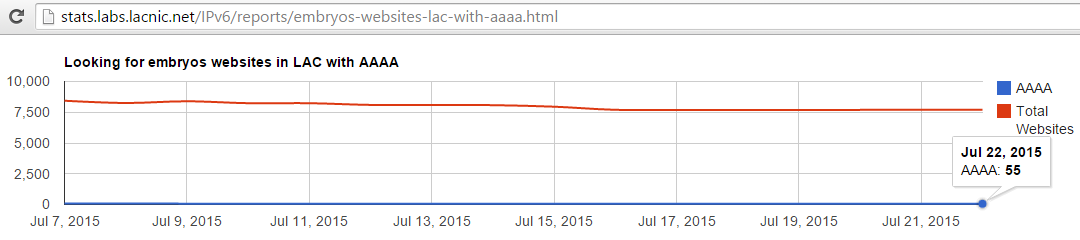
(estadísticas para el 22 de Julio, 7709 dominios estudiados y 55 Websites embrios encontrados)
Gráfico #4. Resumen sitios embriones IPv6
Es muy interesante apreciar que Brasil, Colombia, México y Chile se encuentran en ambos cuadros mientras que Perú y Argentina se intercambian la 4ta posición.
Los resultados pueden ser obtenidos en el sitio: http://stats.labs.lacnic.net y buscando por “Websites actuales con IPv6” y “Embriones Websites (AAAA)” en la columna de la izquierda.
Conclusión: Primero, que nada, es una alegría observar que existen más sitios con IPv6 que embriones por nacer ( claro, de alguna manera se entiende que lo anterior tiene sentido y en realidad no quise caer en comparaciones de otras índoles).
Segundo, se entiende que puede existir un aspecto también de idiosincrasia donde algunos países y administradores sean más cuidadosos -o menos- y no usen un URL de embriones y coloquen su sitio en v6 directamente.
Tercero, de alguna manera podemos esperar que en un futuro consigamos que los sitios embrionarios se conviertan en sitios formales (www) con IPv6.
¿Posibles próximos pasos?- En el presente estudio se evaluó únicamente dominios listados en el TOP 1 millón de Majestic
filtrados por ccTLD de la nuestra región Latam y Caribe, se puede evaluar la manera de extender este estudio a otros listados
- Identificar si la dirección IPv6 que apunta el AAAA es de Lacnic
- Estudiar cuánto tiempo pasa un sitio embrión a un sitio formal con IPv6.
Margen de error:- Se entiende que puede existir un margen de error, un host embrión no significa que sea
necesariamente movido al www del dominio.
Tecnisismos:- Todos los scripts fueron realizados en python3 sobre Linux Ubuntu 13.04
Por:
Alejandro Acosta
Lacnic
@ITandNetworking
*1. Retrospectiva: Acceso IPv6 en la region Latinoamerica y Caribe (LAC) en: http://portalipv6.lacnic.net/retrospectiva-acceso-ipv6-en-la-region-latinoamerica-y-caribe-lac/
*2. https://majestic.com/reports/majestic-million